Empty
No company data is loaded. The interface explains what input it accepts without showing fake certainty.


Target interaction specification
Is operating cash actually covering the business, and which transactions make that statement true?
BI may summarize and classify cash movement, but every total must remain traceable to source rows. Funding and internal transfers must not masquerade as operating performance, and corrections must be reversible without destroying the imported record.
Case-study thesis
This is the behavior to build toward. The implementation receipts below remain the record of what exists today.
A dashboard becomes interaction design when a conclusion can be questioned, opened, corrected, and recomputed without losing provenance.
State model
If two states would look identical to the person, the implementation is not finished.
No company data is loaded. The interface explains what input it accepts without showing fake certainty.
Rows are being parsed and the person can see progress, rejection count, and source file.
Unknown formats, duplicate rows, or ambiguous classifications are isolated before they affect a conclusion.
Each transaction has an explicit business, funding, internal, or unresolved status.
Coverage, runway, and vendor movement are visible with the basis and time window attached.
Opening any total reveals exactly the contributing rows and classification logic.
A person can override a classification, see the summary change, and still recover the original state.
A file or currency the parser cannot safely normalize fails loudly before entering the model.
Edge cases
Definition of done
HAAM produktutgave · What actually moved
I needed to see whether the work was covering the life around it. HAAM BI reads supported bank CSVs, separates owner funding from operating cash, and shows coverage, runway, and vendor drift. The public host uses a synthetic Northwind set so a visitor can see the shape without anyone’s books.
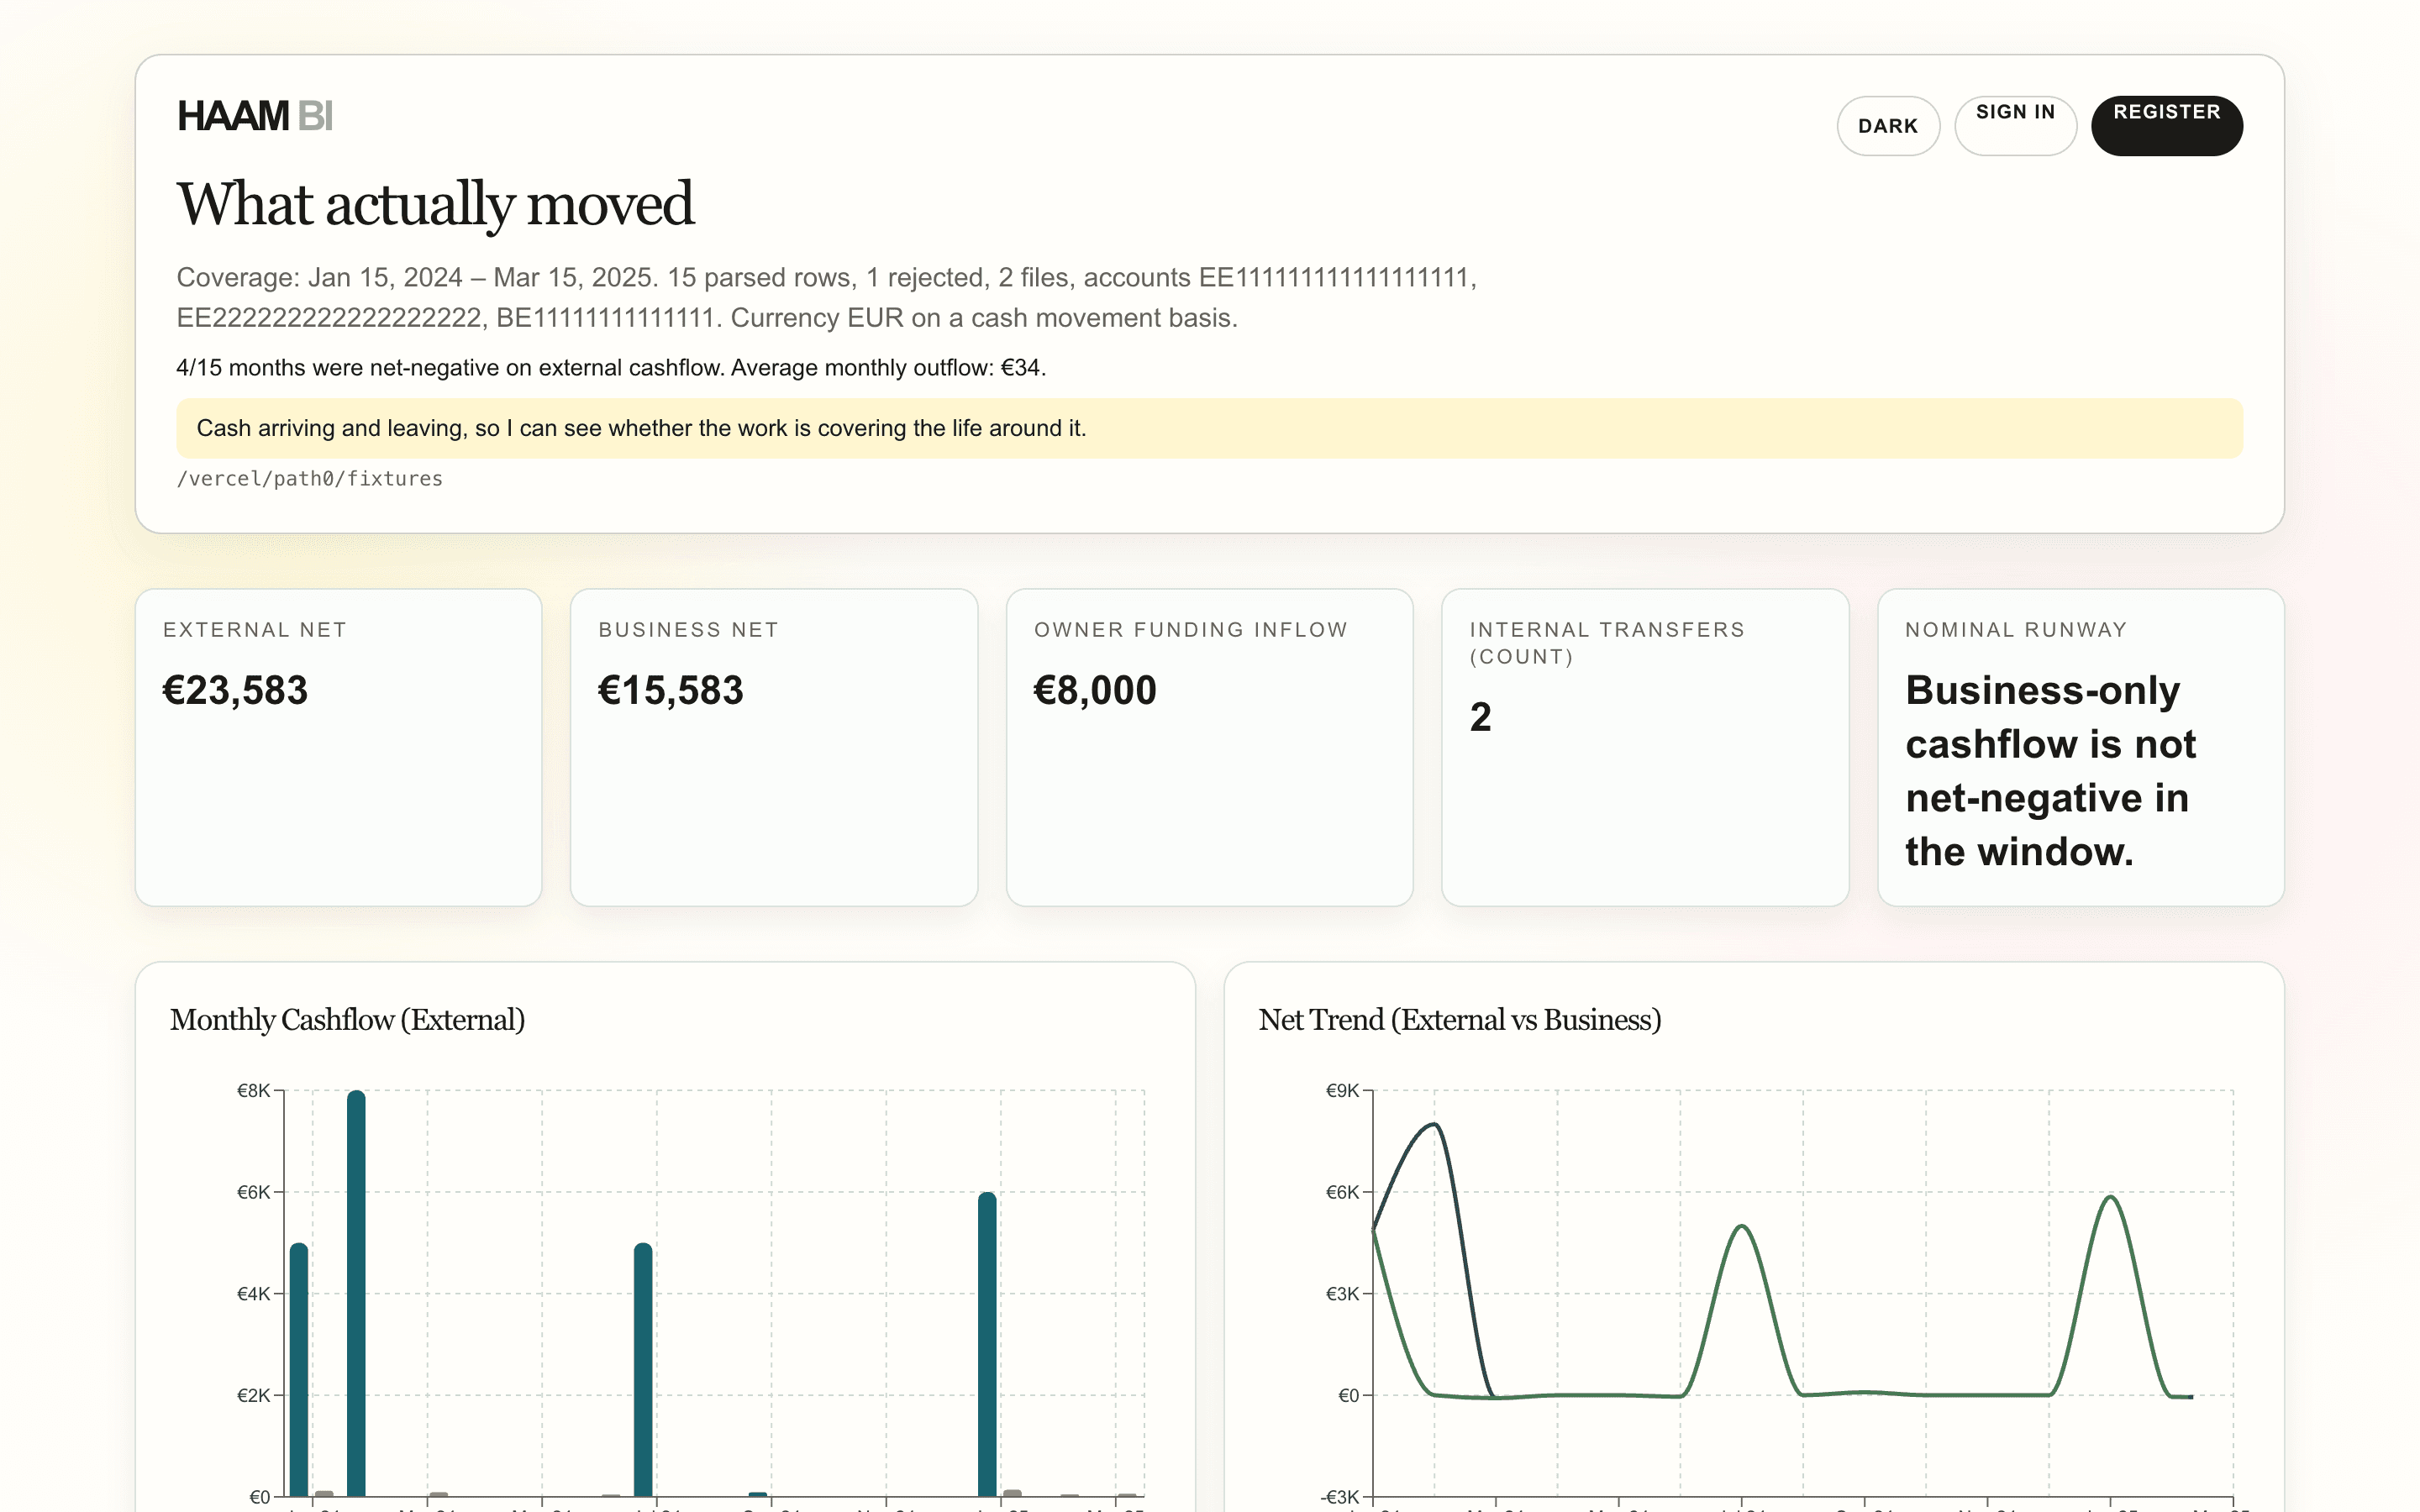
classes
3business, funding, and internal. Owner money in is not treated as operating performance.
supported input
CSVEstonian bank and Wise exports, parsed against a fixture company in tests.
basis
CashCoverage, runway, and vendor drift from movement. Not accrual P&L.
uploads on the host
0bi.haam.co serves Northwind Demo. Owner CSVs stay on the machine in the local app.
The job
Bank exports mix funding, transfers, and operating spend. I needed totals I could drill into, with owner money and internal movement kept separable from the operating picture.
The public host had to be visitable without becoming a place where real books sit. Northwind Demo is that set. The parsers and classification rules are the same ones the local app uses.
Open banking, tax filing, and multi-company SaaS were never this pass.
Reading the month
A highlight that cannot open into transactions is decoration. The fixture totals exist so a reviewer can check the arithmetic.
01
Supported Estonian bank and Wise CSVs become normalized rows. Malformed lines are counted as rejected. Unsupported formats throw.
02
Classification rules mark funding, internal transfers, and business movement. Own-company accounts and the Wise account stay identifiable.
03
Monthly and yearly summaries show inflow, outflow, and whether operating cash is covering the period. Vendor drift sits next to the spend.
04
A total has to name the transactions that made it. Duplicate keys are detected. Optional browser corrections stay local.
Design decisions
bi.haam.co
Classification
The first lie a cash dashboard can tell is mixing recapitalisation with customers. I kept funding and internal transfers visible as their own classes so the operating net stays readable.
Evidence
expected-totals.json is there so a reviewer can rerun the suite and see the same numbers. Personal paths and live IBANs are out of the defaults.
Public host
bi.haam.co is the same interface over synthetic Northwind data. There are no uploads on that host. The local app remains the place where owner CSVs are read.
The working stack
Rules
Normalization, classification, monthly accumulation, and the path from CSV rows to dashboard data.
Insights
computeRunway, vendorDrift, and duplicate detection sit next to the classified rows.
Fixtures
Expected totals in tests. The public host uses Northwind Demo.
Host
Vercel. Local-first for owner files; demo set for visitors.
In evidence
01Funding, transfers, and operating cash stay separable in the totals
02A reviewer can check fixture totals without seeing a real company
03Unsupported formats fail loudly instead of silently skewing a month
04The public host can be opened without uploading a bank file
Where it stops
There is no bank connection, no tax product, and no native import loop in this pass. I have not recorded a full browser import e2e or an accessibility audit.
Personal use of an earlier dirty tree is not evidence in Git. Accrual P&L and audited books are out of scope.
HAAM’s role
Coverage statement, cash-basis limit, funding versus business split, parsers, fixtures, tests, and path sanitization. Direct work, 2026.
How we learned
Research came from the structure of real cash movement and the mistakes a dashboard can make when funding, transfers, and operating activity are mixed together. Synthetic fixtures and expected totals then turned those observations into something that could be checked repeatedly without publishing private financial data.
Optional analytics. Google Analytics and Clarity load only if allowed; form, email, and chat content are excluded.